
The SRE Book, Ten Years On — Part 4: Four Signals and a Pager
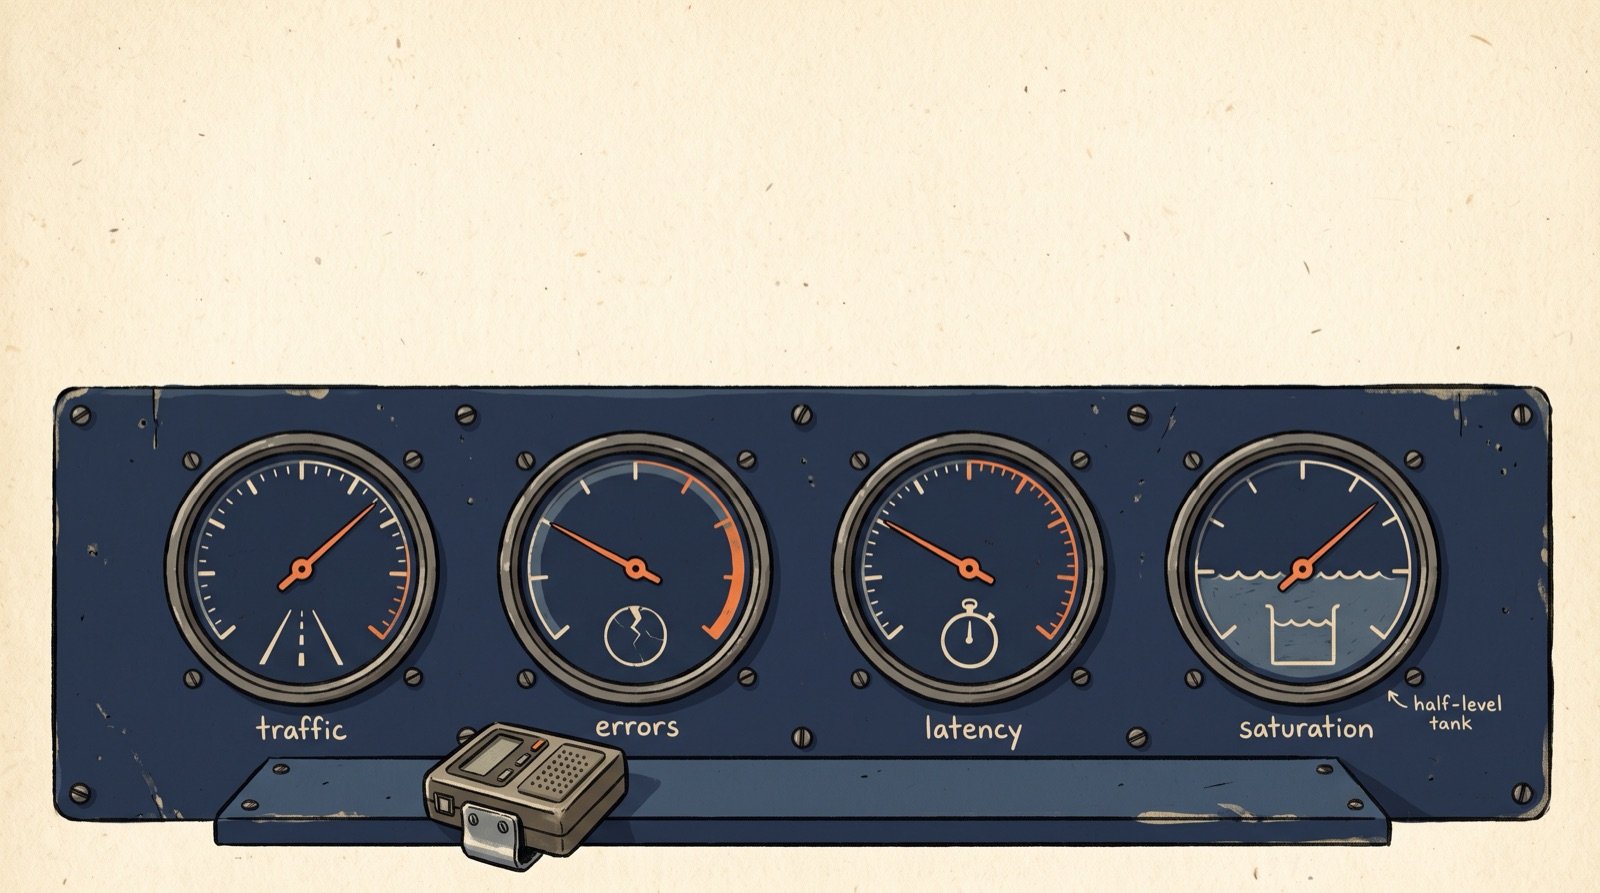
Monitoring and alerting hide the most quoted sentence in SRE literature, the one that eventually changed how the entire industry thinks about pagers:
Never page a human for something a machine can handle.
It sounds obvious. Its consequences are not. Most monitoring systems — then and now — are built the other way around: alert on everything suspicious, and let a human sort out what matters. The diagnosis of that pattern is characteristically blunt: a system that requires a human to read an email and decide whether action is needed is fundamentally flawed. Software should do the interpreting. Humans should be notified only when they need to act.
Getting there takes three things, in order.
In this part
- Know what to actually watch — the four golden signals, and why pages fire on symptoms rather than suspected causes.
- Know what's allowed to interrupt a human — the three valid monitoring outputs, and the checklist every new alert has to survive.
- Build machinery that enforces the restraint — grouping, inhibition, and silences, so "page sparingly" doesn't depend on willpower.
- Ten years on — Borgmon's lineage into Prometheus, and the AIOps trap that was flagged before AIOps existed.
Two real Google outages show what happens when any one of the first three breaks down.
The Four Golden Signals
The golden-signals framework has aged into a cliché, but it’s worth re-reading in the original because the reasoning behind each signal is the real content:
- Latency — how long requests take. Distinguish successful requests from failed ones: an error that returns in 10ms is a different problem from one that times out at 10s.
- Traffic — how much demand the system faces. Requests per second, active sessions, IO rate.
- Errors — the rate of failed requests: explicit (HTTP 500s), implicit (HTTP 200 with the wrong content), and by policy (a response slower than your SLO).
- Saturation — how full the system is: the most future-looking signal, because it anticipates failure before it arrives. CPU, memory, IO — the “what resource is closest to done” question.
Figure: the four signals answer four different questions — how slow, how much, how broken, how close to the edge — and between them cover almost every real production failure.
The deeper point is the distinction between white-box monitoring (internal metrics you only have because you instrumented the code) and black-box monitoring (probing the system from outside, as a user sees it). Black-box catches “the system is down” — white-box catches why.
Figure: one person's cause is another's symptom — a slow query is a symptom to the database team and a cause to the frontend team, which is exactly why pages fire on black-box symptoms only.
The rule
- Page from symptoms, never from guessed causes — black-box reality ("users are unhappy"), not white-box suspicion ("CPU looks high").
- One person's cause is another's symptom. A slow database query is a symptom to the database team and a cause to the frontend team debugging why their page is slow.
- Alerting on causes is how "full disk" becomes a 4 a.m. page — even when that disk being full doesn't actually matter to anyone.
How Google applies it: its own black-box tool, Prober, runs against both the public-facing domain and the individual backend servers sitting behind the load balancer.
Probing both targets separately means a single datacenter going dark shows up as a localised black-box failure (that one target fails) rather than a global one (the public domain is fine because the load balancer routed around it), which is the difference between paging the right on-call engineer and paging everyone.
Tail latency gets the same “measure the real shape, not a summary” treatment. The specific recommendation is to bucket requests by latency into a histogram — 0–10ms, 10–30ms, 30–100ms, exponentially widening buckets — rather than storing an average, because an average of a distribution with a long tail is a number that describes nothing: a system with a 100ms average at 1,000 requests/second can easily have 1% of requests running at 5 seconds, and that 1% is exactly the experience that drives users away.
The Three Valid Monitoring Outputs
The cleanest taxonomy in the business: monitoring can emit exactly three things.
| Output | Meaning | Human action |
|---|---|---|
| Alert | A human must act immediately | Now |
| Ticket | A human must act, but not right now | Within days |
| Log | Nobody needs to see this, but keep it for forensics | Never, unless something else prompts it |
The rule
- Every page must be actionable, and novel. If it doesn't require immediate human action, it's a ticket, not an alert. If it's already known, it's noise, not signal.
- Alert spam gets no mercy. A noisy pager trains humans to ignore the pager — at which point the entire monitoring investment is worth zero.
Before shipping any new alerting rule, run it through the same four questions every time:
New alert checklist
- Does it catch something otherwise undetected, urgent, and user-visible?
- Will I ever be able to shrug it off as benign — and if so, why does it exist at all?
- Can I actually act on it — and could that action be automated instead?
- Is someone else already getting paged for the same thing?
Two long-term case studies make the payoff concrete, and both are worth telling with their actual numbers, because the “just page less” advice sounds glib without them.
Bigtable’s SRE team was drowning in noise. Their SLO was pinned to mean latency, but the underlying storage stack had a long tail, so email and pages fired constantly on a metric that didn’t reflect what users actually experienced — engineers spent more time triaging alerts than fixing the problems the alerts were supposedly about, and real user-affecting issues got lost in the volume.
The fix was three-pronged and temporary by design: dial the SLO target back to the 75th percentile instead of the mean (buying breathing room), disable the email-alert channel entirely (it was unreadable at that volume anyway), and use the freed-up engineering time to actually fix the storage stack’s tail latency — not to live with the lowered bar forever.
Gmail’s case is different. An early scheduler (repurposed from Google’s batch-processing system) would routinely “de-schedule” individual tasks, each representing a fraction of a percent of users, and paging on every de-schedule event was unsustainable given the task count.
The team built a tool to nudge the scheduler back into a good state automatically, deliberately choosing not to fully automate the entire detect-and-fix loop yet, on the theory that automating a workaround too eagerly can quietly become permanent and delay the real fix.
Both stories share the same moral: a page that has a known, scriptable, non-judgment-requiring response is a bug in your alerting, not a fact of life — either the response gets automated, or the root cause gets fixed, and “we just page a human every time” is never the third acceptable option.
Alertmanager: The Machinery Behind “Page Sparingly”
The mechanics behind not paging on every blip are as engineered as the golden signals themselves. Borgmon’s alerting rules require a condition to stay true for a minimum duration — the standard example holds an error-ratio threshold breach for two minutes before it’s allowed to fire, specifically so a single bad scrape or a momentary blip can’t trigger a page on its own.
Once a rule does fire, it routes through a central Alertmanager, whose entire job is noise reduction at the routing layer: it can inhibit a whole class of downstream alerts while a known upstream cause is already firing (don’t page five teams for one root cause), deduplicate identical alerts arriving from multiple redundant monitoring replicas, and fan alerts in or out based on their labels so one incident produces one page, not twenty.
Prometheus’s own Alertmanager — the direct open-source descendant — implements this exact same three-part job today, down to the “for” duration syntax.
Beyond Google: Golden Signals as a Lingua Franca
The four golden signals travelled further than Borgmon or Prometheus ever did — they became the shared vocabulary multiple companies independently reach for when they need to explain monitoring priorities to a team that’s never touched Google’s original playbook.
Uber’s incident-response approach explicitly starts from the same four (traffic, errors, latency, saturation) before layering an OODA loop (observe, orient, decide, act) on top for the response itself, and built a CLI tool nicknamed omg specifically to cut the cognitive load of context-switching into an unfamiliar incident — the same “reduce interrupt cost” instinct Part 5 covers for on-call generally.
The signals turned out to be closer to a universal periodic table of “what can go wrong with a serving system” than a Google-specific quirk, which is presumably why they show up unattributed in monitoring vendor documentation industry-wide a decade later.
Figure: the three-outcome routing tree — page only when a human must act now, and nothing else qualifies.
Ten Years On: Borgmon’s Lineage, and the AIOps Trap
The most satisfying technical thread here is a lineage that was predictable from day one. Borgmon, Google’s home-grown monitoring system, named Prometheus as its open-source spiritual twin early on.
Figure: the 2016 stack, traced to its 2026 open-source descendants. (For how the signals themselves are emitted and standardised, the Practical OpenTelemetry series covers metrics, semantic conventions, and the Collector end to end.)
And then there’s the trap that was flagged before it existed. “Magic systems that try to learn thresholds or automatically detect causality” is the phrase that anticipated, a decade early, the entire AIOps marketing category. Part 3 covered why this is structurally the same trap around toil, applied here to monitoring specifically.
By March 2026 both Microsoft’s Azure SRE Agent and AWS’s DevOps Agent had shipped general-availability products that read telemetry, correlate across historical incidents, and execute pre-approved runbooks autonomously for known failure classes — genuinely past the suggestion stage, but still demonstrably better at recognising a failure that resembles one they’ve seen before than at reasoning about a genuinely novel one.
Thresholds learned by a model are thresholds you can’t reason about; correlation dressed as causation is the exact “magic system” flagged decades ago, just with a better UI around it now. LLM-assisted incident summarisation is genuinely useful; LLM-decided alerting recreates the same email-driven chaos golden-signal monitoring buried, with a fancier subject line.
The takeaway
Monitor from the user's perspective (black-box), alert on symptoms, page sparingly, and treat the pager as a promise to the person wearing it. Everything else is a log entry.
Key takeaways
- Four signals cover almost everything. Latency, traffic, errors, and saturation answer four different questions — how slow, how much, how broken, how close to the edge — and saturation is the only one that warns you before the failure lands.
- Page on symptoms, never on suspected causes. One team's cause is another team's symptom, which is why black-box reality ("users are unhappy") pages and white-box detail ("CPU looks high") only explains.
- A page is a promise, and alert spam breaks it. Monitoring may emit exactly three things — alert, ticket, log — and anything that doesn't need action right now is one of the latter two. A noisy pager trains people to ignore it, which zeroes the entire monitoring investment.
- Restraint has to be built into the machinery. Grouping, inhibition, and silences are what make "page sparingly" survive a real incident — willpower alone doesn't.
- Learned thresholds are thresholds you can't reason about. Today's agents genuinely investigate, but they're strongest on failures resembling ones they've seen — so LLM-assisted summarising helps, while LLM-decided alerting rebuilds the noise problem with a better UI.
Next: Part 5: On-Call — the 25% Rule and the Cost of a Context Switch, on the human side of the pager.
References
- Google SRE Book — Monitoring Distributed Systems and Practical Alerting
- The SRE Workbook — Alerting on SLOs
- Prometheus · Alertmanager · PagerDuty
- Inside Uber’s Incident Response Plan
- Azure SRE Agent GA announcement (March 10, 2026) · AWS DevOps Agent GA announcement (March 31, 2026) · RC-LLM
- What Is AIOps in 2026? · Azure SRE Agent
Have thoughts on this?
I read every email. If something resonated, felt wrong, or made you think — I'd love to hear from you.


Comments